Desktop - Requests
Desktop - Requests
Time frame
Shows a timeline displaying counts of requests at given date/times.
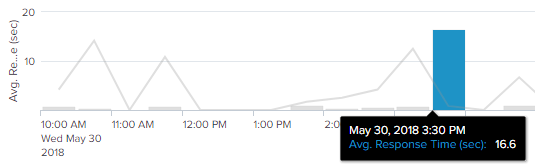
Hover the mouse over a respons bar in the time frame chart to see Avg. Response time and a timestamp:
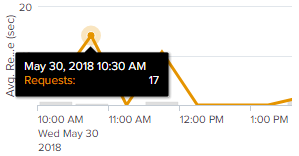
Or hover over a request to see the count of requests and a timestamp:
Requests.
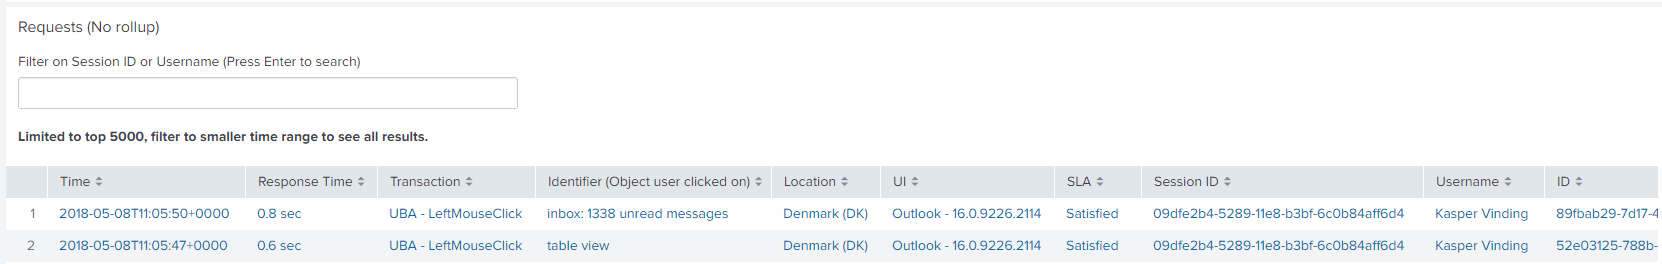
Shows a table of the different user interfaces and the following columns:
- Timestamp: A time stamp in the format
<YYYY-MM-DDThh:mm:ss>. - Response time: How long time the measured response time was, in seconds.
- Transaction: Name of the transaction.
- Identifier: Name of the identifier that the transaction reacts on.
- Location: Name of the country or city from where the request is made.
- **UI:**What user interface is being measured, for example Outlook.
- SLA: A value based on the SLA definition from one of the following 3 options:
- Satisfied
- Tolerated
3. Frustrated
Service Level Agreements, are defined in the SLA chapter.
For more information about SLA, look here.
- Session ID: Unique ID for the specific session.
- **Username:**Name of the user who performed the request.
- ID: Unique ID of the user.
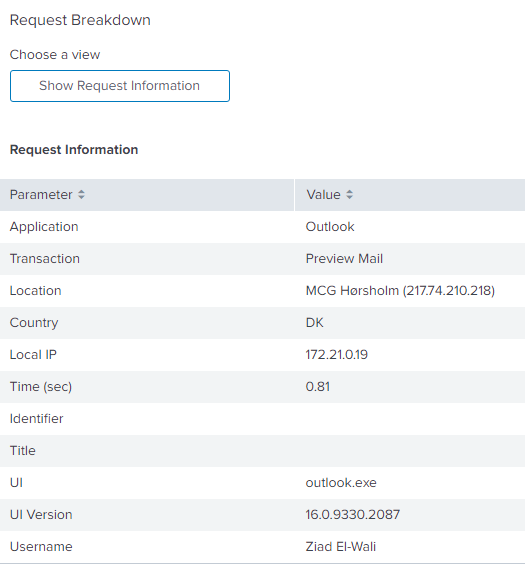
Showing a request breakdown.
If you wish to see additional information about a request you can break it down by clicking a row in the "Request" table.
Then a new window shows up in the right side, by the name "request breakdown".